Sometimes when I am asked to look into some issue or I have to debug some out of the box functionality in Maximo, I start wondering where to start.
Logs are one good place to start debugging. Turning the logger level of appropriate loggers to debug prints lots of information in the system out (which can be a performance overhead also so be cautious).
To print more specific details of the class that is writing these logs there is a tweak that can be done in the logging application.
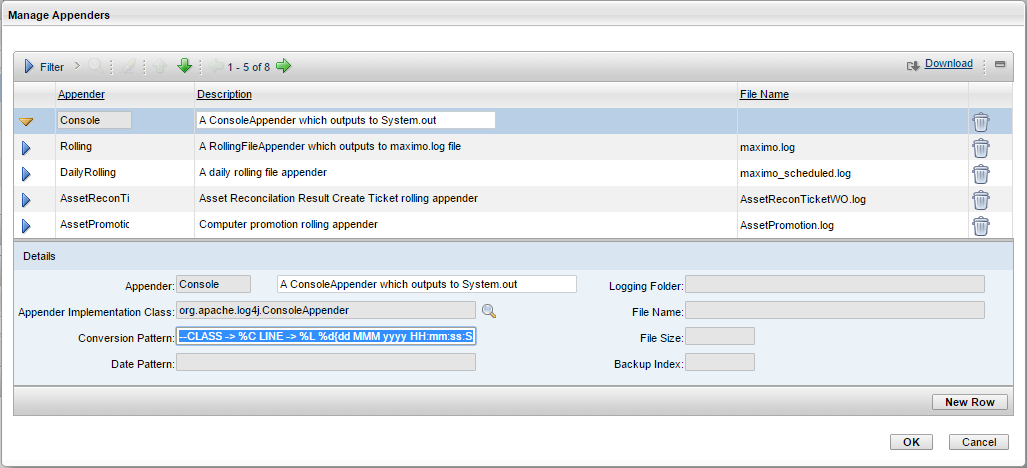
In the logging application, in the Manage Appenders dialog in the select action, select the console appender. In the table details, update the Conversion Pattern to
–CLASS -> %C LINE -> %L %d{dd MMM yyyy HH:mm:ss:SSS} [%-2p] [%s] [%q] %m%n
This will print the classname and the line number for all the log entries made in the systemOut.log and maximo.log, which will look something like this –

This can be the starting point for your debugging. If you created custom appenders, this tweak can be implemented on the custom appenders leaving the console appender as it is.